Waikato
Location
2025
Completed
~21kW
System size
North & south
Arrays
Two independent
Inverters
None
Battery
1,328kWh
Exported
Real monitored
Performance
Project Highlights
The headline facts, all backed by real billing and monitoring data rather than software estimates.
- Approximately 21kW residential solar system
- North and south roof arrays
- Two independent inverters
- No battery storage
- Real Genesis Energy before-and-after billing comparison
- 78% reduction in electricity costs
- 52% reduction in total household energy costs
- 1,328kWh exported during the comparison period
- Real monitored performance, not software estimates
The Property
Before the results, it helps to know what kind of home this is. This is a large, busy family home in Hamilton, not a purpose-built showcase.
- Large multi-level family home in Hamilton
- Swimming pool
- Ducted air conditioning
- Gas hot water
- Surrounded by mature trees
- High household electricity use
- Two-phase electrical supply
A Real-World Test
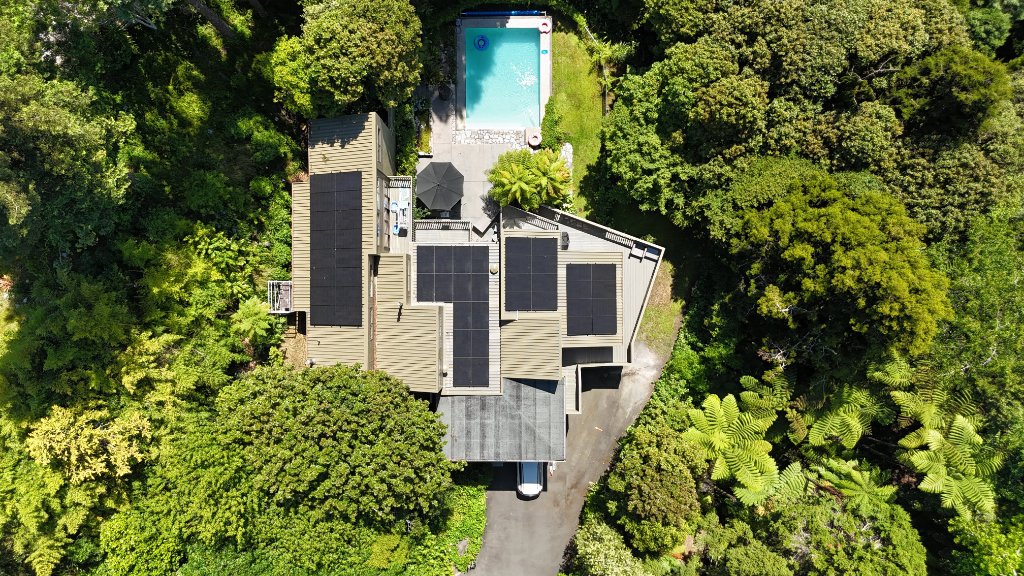
Before installing the system, we knew the house had good roof space, but we also knew it wasn't a perfect solar site. The property sits down in a gully and is surrounded by mature trees. While there were good north-facing roof areas, there was always some uncertainty about how much the surrounding environment would affect production throughout the day. Rather than relying only on software modelling, we decided to use our own home as a long-term test. The results genuinely surprised us. Despite the property's location, the system consistently exceeded our expectations. This project reinforced something we've seen time and time again. Good solar design isn't about finding the perfect roof. It's about understanding how the property uses electricity and designing the system to match. Careful panel placement, understanding how the household actually uses electricity, and spreading generation across both north and south roof faces produced excellent real-world results. One of the biggest lessons from this project is that a property doesn't have to be perfect to achieve excellent solar performance.
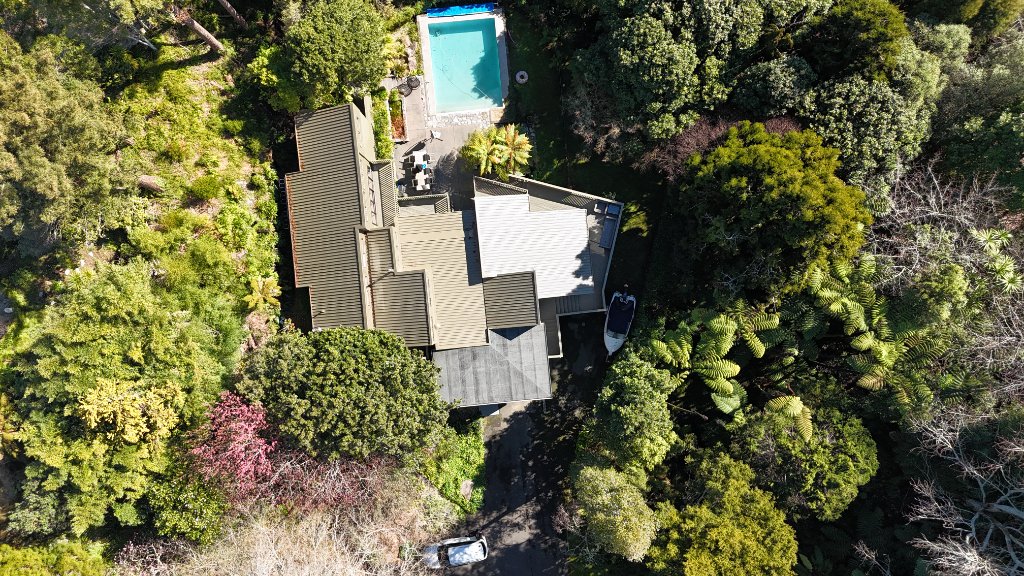
The aerial view shows this wasn't a perfect open site. The house sits down in a gully, surrounded by mature trees, yet the system still produced excellent results. Solar doesn't have to be installed on the perfect property to deliver excellent outcomes.
System Specification
A concise, scannable breakdown of what is on the roof, and the thinking behind it.
- Approximately 21kW residential solar PV system
- Trina Solar panels
- Clenergy mounting rail system
- Two 10kW Entelar string inverters
- Two-phase residential electrical supply
- North and south roof arrays
- Grid-connected
- Battery-ready
- Real-time monitoring
Around 21kW is a large residential system, and customers often ask why it was sized that way. The objective wasn't to maximise exports. It was to match the home's actual daytime electricity use. With a swimming pool, ducted air conditioning and a busy family at home during the day, this household draws a lot of electricity while the sun is up. Sizing the array to that demand, and spreading it across north and south roof faces, is what produced such a large drop in imported electricity.
Rather than relying on a single roof face, the system was intentionally split across both north and south roof areas to extend generation across more of the day. Using two independent 10kW Entelar inverters allowed each roof orientation to operate independently and maximise production from each array. The house has a two-phase electrical supply, so the system was designed to integrate with the existing electrical infrastructure while balancing generation across both phases. The Clenergy mounting system was selected to suit the roof profile and provide a long-term, durable installation. The objective wasn't to install the biggest system possible. The objective was to produce the maximum amount of usable energy over the longest possible period each day. This project reinforced something we've seen repeatedly. The best solar systems aren't designed around roof size. They're designed around how the household actually uses electricity.
Why This Project Matters
This project is different from a typical residential case study. Most solar companies publish estimated savings. This project uses real power bills, real monitoring data and real household usage collected over months. The graphs tell the story more honestly than any estimate could. It demonstrates how a properly designed system performs under normal family living conditions, including:
Real household conditions over the comparison period
- Swimming pool
- Ducted air conditioning
- Christmas holidays
- Guests staying
- Mixed weather
- High household electricity use
Read more about our residential solar services, battery storage, and monitoring and servicing, or learn about 2E Electrical.
What Surprised Us
Some of the results ran against the usual assumptions about residential solar. These were the standouts.
South-facing solar produced far more useful energy than expected
The south-facing arrays were expected to be the weaker performers, but they kept generating useful energy across more of the day than we expected, especially through shoulder and overcast periods. Spreading the array across north and south faces turned out to be a better strategy than pointing everything north.
Batteries weren't necessary for an excellent financial result
Without any battery storage, the system still cut electricity costs sharply by offsetting daytime load and exporting surplus. A battery may still make sense later, but this result shows storage isn't a prerequisite for a strong return on a well-designed residential system.
Spreading generation across the day beat chasing the midday peak
A bigger midday spike looks good on paper, but spreading generation across the morning and afternoon matched the household's actual usage better and reduced reliance on export. It's a reminder that peak generation and useful generation aren't the same thing.
Gas hot water became the largest remaining energy cost
Once the solar was in, the electricity bill dropped so far that gas hot water stood out as the biggest remaining household energy cost. That pointed straight to the next logical upgrade.
Monitoring identified the next logical upgrades
Live monitoring didn't just confirm the system was working, it showed exactly where the remaining energy costs were. The clear next steps are heat pump hot water, EV charging, battery storage and future ESCOUT integration, each adding more value on top of the solar base.
Before & After: Real Genesis Energy Billing & Usage
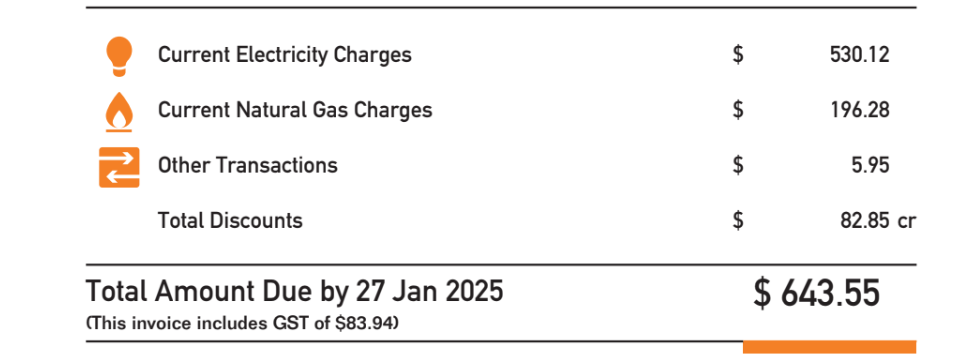
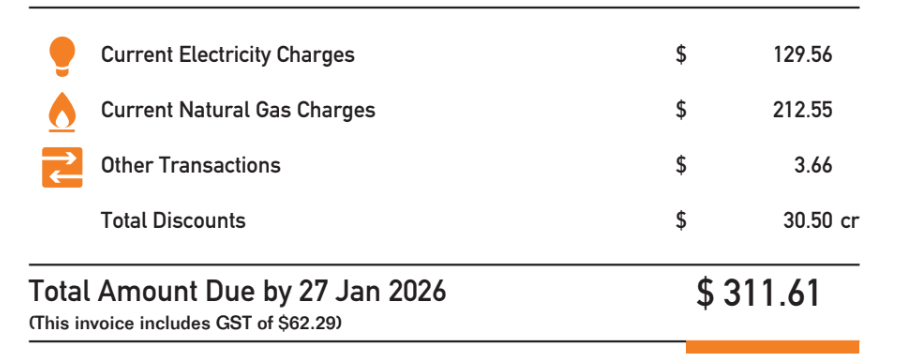
This comparison uses real billing and usage data from two billing periods, before and after the solar system went in. These aren't software estimates. They're actual Genesis Energy bills and usage reports from the same property across comparable billing periods. The graphs tell the story more honestly than any estimate could.
78%
Reduction in electricity costs
52%
Reduction in total household energy costs
1,328kWh
Exported during the comparison period
Before Solar
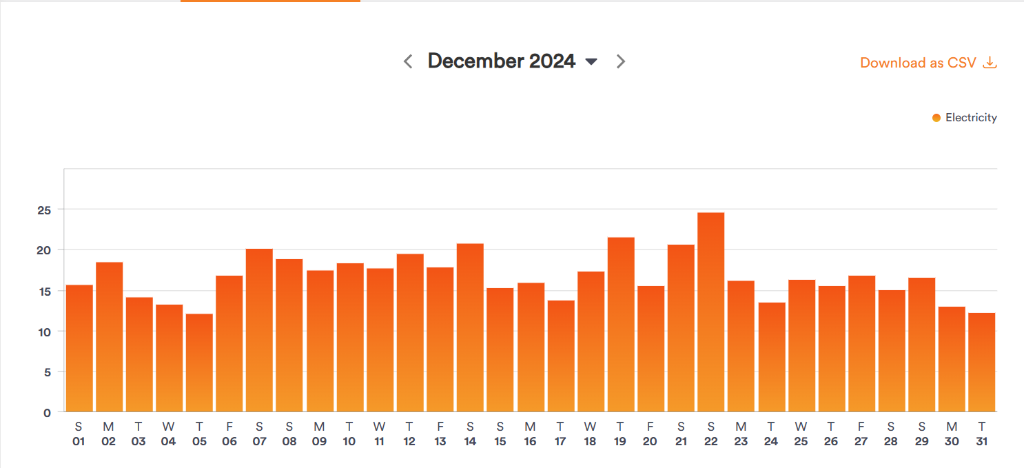
The home consistently imported around 12 to 25kWh every day throughout December. Electricity was simply something we bought from the grid.
After Solar
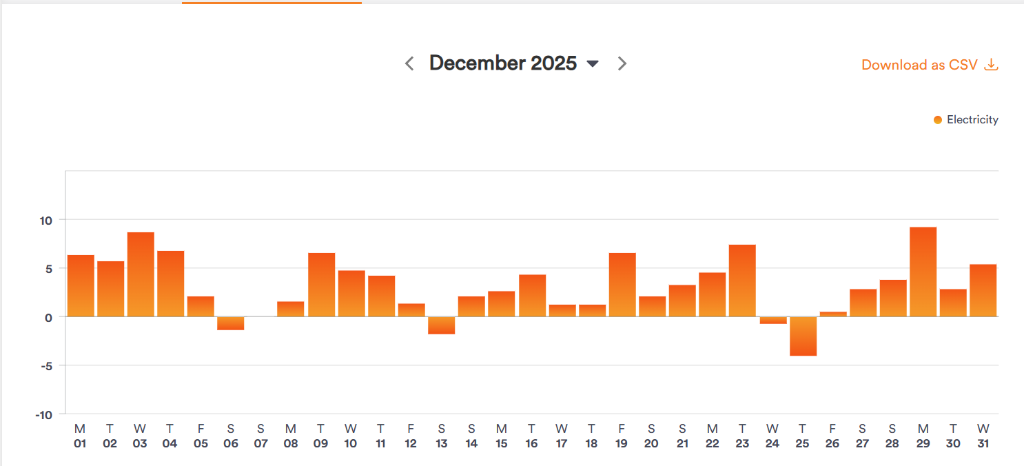
The graph immediately shows something very different. Many days became net export days. Instead of importing electricity all day, the home regularly generated more electricity than it consumed. This visual tells the story better than paragraphs of text.
Reading the Results
Positive values represent electricity exported back to the grid. Negative values represent electricity imported from the grid. One of the biggest differences between the two graphs is that the post-installation graph regularly moves into export during the middle of the day. That demonstrates the solar system is producing more electricity than the house requires at those times.
Keeping it Honest
This comparison is between two real billing periods. Weather varied. Household occupancy varied. Christmas occurred during both periods. Like every household, energy use changes from year to year. However, the difference is still significant enough to clearly demonstrate the impact the solar system had on imported electricity.
A Lesson for Customers
Many people focus on the monthly power bill. The graphs tell a much more interesting story. They show when electricity is being used and when solar is producing it. Understanding those patterns is what allows a solar system to be designed properly. That's why we design systems around how people actually use electricity, not simply around roof size.
One Final Comparison
Before Solar
Imported electricity every day.
After Solar
- Regular daytime exports.
- Less imported electricity.
- Much lower electricity bill.
Sometimes the simplest visual explains the biggest change.
Related Services
Residential Solar
Solar designed around how your household actually uses electricity, not just a generic north-facing array.
Learn moreBattery Storage
Add storage to shift solar into the evening and keep the important things running in an outage.
Learn moreSolar Servicing
Live monitoring, performance checks and ongoing servicing for systems we install and inherit.
Learn moreEvery home tells a different story.
This project shows what happened at ours.
Your home will be different.
Different roof.
Different trees.
Different electricity use.
Different family.
That's exactly why every system we design starts with understanding how you use electricity, not simply how many panels fit on the roof.
Talk to Us About Your Home Solar Project
If you've been told your place isn't a good solar site, or you just want honest figures based on how your household actually uses electricity, we'll come out, look at the roof and the bills, and show you what's really possible.
Book Your Free Assessment
Tell us about your place and we'll be in touch.